Finally we’re ready to run our test plan. Choose “Start” from the “Run” menu to begin the test and highlight the “View Results in Table” element to see your results. You should get something similar to the following:
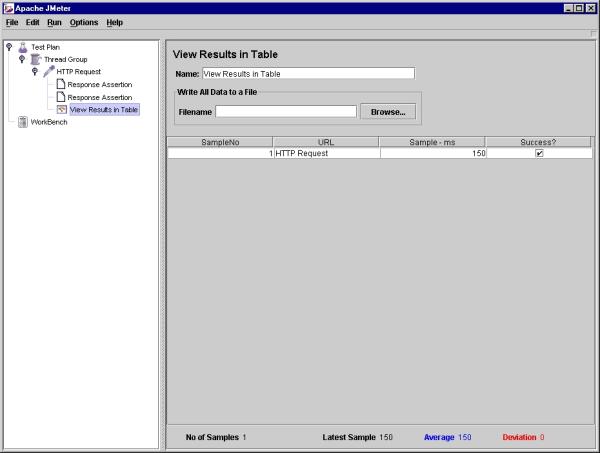
Of course, your run times will vary. The “Success” box should be checked if everything went as planned. If not, add an “Assertion Results” element to help debug your problem. Or, you can see the page exactly as JMeter sees it by adding a “View Results Tree” from the Listener menu. The View Results Tree shows the full request made to the page and the full response, which is
very useful when debugging your test plan.
very useful when debugging your test plan.
Pay special care to how you nest the elements, It does make a difference. For example, if you have a Listener element on the same level in the tree as 2 sampler items, the Listener will get results for both of the samplers. While if the listener was added as a child item of the Sampler, the Listener would only get results from its parent element. The same can be said about assertion elements. So our generic assertion that looks for common error strings on any page can be added on the same level as the samplers. While the data specific assertions should be a child of the page they check.
You’re already starting to see how the complexity of these tests can grow exponentially on large applications. When you have one sampler for each module in your web application, the tree fills up fast! One element that can help keep your test plan manageable is the “HTTP Request Defaults” element. Instead of filling in the server and port options on each Sampler, you can leave them blank and the sampler will automatically use values from a HTTP Request Defaults element on the same or higher level in the tree. This can save gobs of time not only when setting the plan up, but also if the application ever moves to a new server.