In his 1974 paper, “Structured Programming with go to Statements”, famed computer scientist Donald Knuth famously proclaimed premature optimization to be “the root of all evil.” While it is indeed a good idea to avoid spending too much time on code optimization during the early stages of any project, eventually you’ll want to seek out and resolve any bottlenecks in order to ensure your application is operating at its full potential.
Which brings us to the question of how to even go about determining which parts of an application could conceivably be optimized. One common approach involves using a profiler such as Xdebug, which can analyze your code and produce performance reports. These reports can then be reviewed within a profiling visualization tool such as KCacheGrind.
In this article I’ll show you how to use Xdebug and KCacheGrind to begin profiling and analyzing your PHP-driven Web applications.
Installing Xdebug
Xdebug is a powerful open source PHP debugging and profiling tool. Although you’re free to compile Xdebug from source, the easiest installation approach involves using PECL:
%>pecl install xdebug
Once installed, add the following lines to your
php.ini file:
zend_extension="/full/path/to/xdebug.so"
xdebug.profiler_enable = 1
xdebug.profiler_output_dir = /var/www/xdebug/
xdebug.profile_output_name = cachegrind.out.%t-%s
Of course, you may want to change the
xdebug.profiler_output_dir setting to a more desirable location. After saving the php.ini file, restart Apache in order for the changes to take effect.Keep in mind that this will cause profile reports to be created every time a PHP script is run on this Web server. If you want to profile scripts selectively, add the following line to your
php.ini file:
xdebug.profiler_enable_trigger=On
After restarting Apache, you’ll be able to profile scripts selectively by appending
?XDEBUG_PROFILE=1 to your URL.Installing KCacheGrind
KCacheGrind is available for installation from within most operating systems’ software repositories. For instance, if you’re running Ubuntu you can install KCacheGrind using the following command:
%>sudo apt-get install kcachegrind
If you’re running Windows, check out WinCacheGrind.
Creating a Profile Report
With Xdebug and KCacheGrind installed, you can begin profiling your PHP scripts. If you opted not to enable the
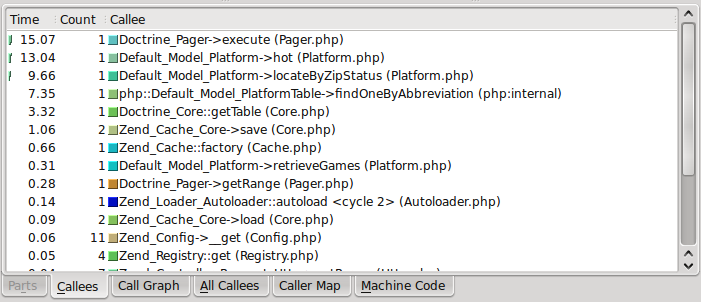
xdebug.profiler_enable_trigger configuration directive, then a new report will be created every time you execute a PHP script from within your browser. Each time you do so, a file will be created within the designated reporting directory, which looks like cachegrind.out.1447. The contents of this file aren’t intended for human consumption, but rather should be passed to an analysis tool such as KCacheGrind.Loading the report into KCacheGrind opens a world of insight in terms of your ability to know for certain which operations are the most expensive. For instance, consider the output presented in Figure 1, which presents the call stack for a Zend Framework- and Doctrine-driven project I’m currently working on.
I’ve sorted the execution time of each call in order to determine which calls are the most expensive. The call to the
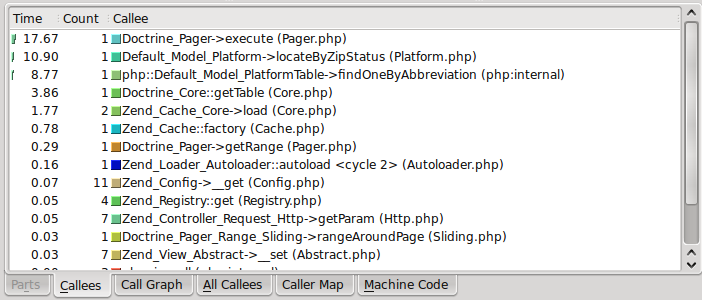
Default_Model_Platform model’s hot() method ranks up towards the top, and because I know this data changes only every few hours, now I can safely cache it and thereby eliminate this expensive database query (which is indeed a fairly large JOIN operation). After implementing caching I again profile the page and indeed have eliminated that expensive call altogether (see Figure 2).


