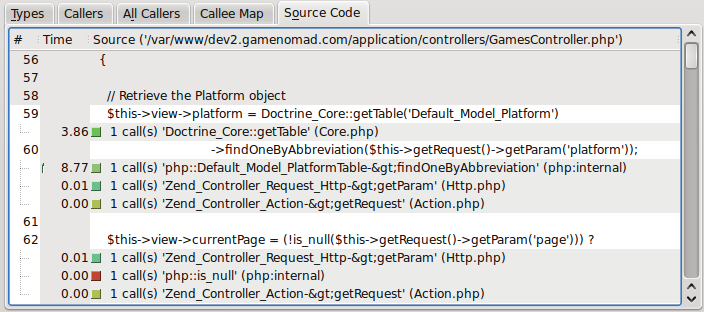
Reviewing Performance Using the Source Code
KCacheGrind offers numerous ways to peer into your application’s performance, among them the ability to tie execution times directly to the source code. Figure 3 presents KCacheGrind’s annotated view of the profiled source code, prepending the execution time to each respective line.
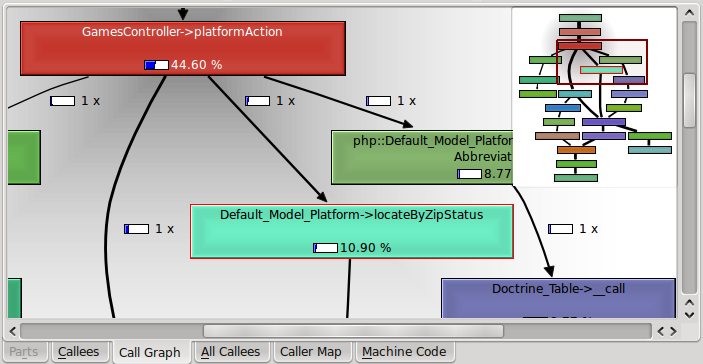
Reviewing Call Graphs
Another interesting way to peer into your application’s execution cycle is via KCacheGrind’s Call Graph feature, an example of which is found in Figure 4. This graph not only traces the execution flow, but also associates call frequencies and the amount of total execution time required by each step in the cycle.
Further Reading
Xdebug and KCacheGrind offer invaluable insight into application performance, not only presenting a comprehensive breakdown of the entire cycle’s execution time but also providing the ability to visually trace the execution path using a variety of tabular and flowchart-based views. Be sure to check out the following resources for more information about optimizing your PHP applications:
- PHP performance tips: A short but insightful series of PHP optimization tips
- Memcached: A popular caching solution used by high-traffic sites including Digg, Craigslist, and Twitter, among others
- The Alternative PHP Cache: A popular PHP code caching and optimization solution
About the Author
Jason Gilmore is founder of the publishing, training, and consulting firm WJGilmore.com. He is the author of several popular books, including “Easy PHP Websites with the Zend Framework”, “Easy PayPal with PHP”, and “Beginning PHP and MySQL, Fourth Edition”. Follow him on Twitter at @wjgilmore.