This adds a second dataset. We can add as many datasets as we wish, using as many different graph types as we wish. Of course, there’re only viably two different axes available, that to the left and to the right of the graph. The above graph isn’t very friendly, as the bars aren’t distinct due to them having to share scaling with the line part of the graph. Let’s add that second axis now. To do so is easy:
<?php
include 'Image/Graph.php';
$Graph =& Image_Graph::factory('graph', array(600, 300));
$Plotarea =& $Graph->addNew('plotarea');
$Dataset =& Image_Graph::factory('dataset');
$Dataset->addPoint('Jan', 5, 'J');
$Dataset->addPoint('Feb', 13, 'F');
$Dataset->addPoint('March', 10, 'M');
$Plot =& $Plotarea->addNew('bar', &$Dataset);

$Plot->setLineColor('green');
$Plot->setBackgroundColor('[email protected]');

$Dataset2 =& Image_Graph::factory('dataset');
$Dataset2->addPoint('Jan', 90);
$Dataset2->addPoint('Feb', 40);
$Dataset2->addPoint('March', 120);
$Plot2 =& $Plotarea->addNew('line', &$Dataset2, IMAGE_GRAPH_AXIS_Y_SECONDARY);

$Plot2->setLineColor('firebrick'); // yes, that's a colour
$Plot2->setBackgroundColor('[email protected]');

$fill =& Image_Graph::factory('Image_Graph_Fill_Array');
$fill->addColor('[email protected]', 'J');
$fill->addColor('[email protected]', 'F');
$fill->addColor('[email protected]', 'M');
$Plot->setFillStyle($fill);

$Font =& $Graph->addNew('ttf_font', 'Bitstream-Vera-Sans-Mono');
$Font->setSize(12);
$Graph->setFont($Font);

$YAxis =& $Plotarea->getAxis(IMAGE_GRAPH_AXIS_Y);
$YAxis->setTitle('Rainy Days', 'vertical');
$XAxis =& $Plotarea->getAxis(IMAGE_GRAPH_AXIS_X);
$XAxis->setTitle('Month');

$YAxisSecondary =& $Plotarea->getAxis(IMAGE_GRAPH_AXIS_Y_SECONDARY);
$YAxisSecondary->setTitle('Butterfly sightings','vertical');

$Graph->done();
?>
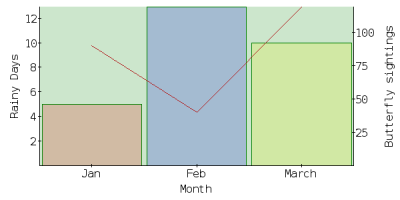
Note that when defining $Plot2 while calling the addNew method on the $Plotarea object, we pass a third parameter, IMAGE_GRAPH_AXIS_Y_SECONDARY. This is then used when detailing the second axis, the second and third-last lines of the code.
Different axis direction
But what if you want the axis to go the other way, from top to bottom? This could be desirable because the values are negative, or that it just makes more sense to display that way. Again using image_graph4 as a basis, let’s look at an example with an axis going the other way. We’re going to create two plotareas, as we did in the final example last month, with the graph on one having an axis counting up from top to bottom. The grid we create has space for a heading (5% of the height), and the two graphs beneath that both take up 50% of the width.
2image_graph6.php

<?php
include 'Image/Graph.php';
$Graph =& Image_Graph::factory('graph', array(600, 300));

$Graph->add(
  Image_Graph::vertical(
      Image_Graph::factory('title', array('Top to bottom axis', 12)),
      Image_Graph::horizontal(
         $Plotarea1 = Image_Graph::factory('plotarea'),
         $Plotarea2 = Image_Graph::factory('plotarea'),
       50
      ),
      5
   )
);

$Dataset1 =& Image_Graph::factory('dataset');
$Dataset1->addPoint('Jan', 5, 'J');
$Dataset1->addPoint('Feb', 13, 'F');
$Dataset1->addPoint('March', 10, 'M');

$Dataset2 =& Image_Graph::factory('dataset');
$Dataset2->addPoint('Jan', -6, 'J');
$Dataset2->addPoint('Feb', -13, 'F');
$Dataset2->addPoint('March', -10, 'M');

$Plot1 =& $Plotarea1->addNew('bar', &$Dataset1);
$Plot2 =& $Plotarea2->addNew('bar', &$Dataset2);

$Plot1->setLineColor('green');
$Plot1->setBackgroundColor('[email protected]');

$fill =& Image_Graph::factory('Image_Graph_Fill_Array');
$fill->addColor('red@0.2', 'J');
$fill->addColor('blue@0.2', 'F');
$fill->addColor('yellow@0.2', 'M');
$Plot1->setFillStyle($fill);
$Plot2->setFillStyle($fill);

$Font =& $Graph->addNew('ttf_font', 'Bitstream-Vera-Sans-Mono');
$Font->setSize(12);
$Graph->setFont($Font);

$YAxis1 =& $Plotarea1->getAxis(IMAGE_GRAPH_AXIS_Y);
$YAxis1->setTitle('Rainy Days', 'vertical');
$XAxis1 =& $Plotarea1->getAxis(IMAGE_GRAPH_AXIS_X);
$XAxis1->setTitle('Month');

$YAxis2 =& $Plotarea2->getAxis(IMAGE_GRAPH_AXIS_Y);
$YAxis2->setTitle('Minimum Temperature', 'vertical');
$XAxis2 =& $Plotarea2->getAxis(IMAGE_GRAPH_AXIS_X);

$Graph->done();
?>
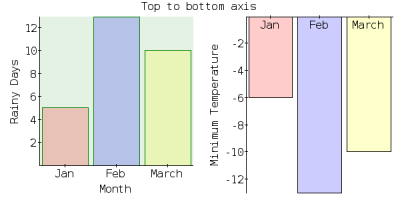
Note that the x-axis label on the right graph appears below the line, in the body of the graph. I haven’t been able to find a way to overcome this. It won’t have as much consequence in other cases, such as when using a line graph, but it’s still an annoyance. If I find out how, I’ll update the article.
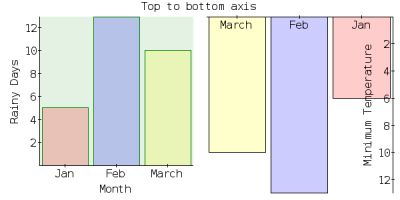
The axis is reversed by default if using negative values, as one would expect, but there’s a way to reverse the axis even if using positive values. Simply use the setInverted method. You can use this method on both the X and Y axis (although the same problem applies of the labelling appearing to the left of the line, in the body of the graph. Here’s an example:
2image_graph7.php

<?php
include 'Image/Graph.php';
$Graph =& Image_Graph::factory('graph', array(600, 300));

$Graph->add(
  Image_Graph::vertical(
      Image_Graph::factory('title', array('Top to bottom axis', 12)),
      Image_Graph::horizontal(
         $Plotarea1 = Image_Graph::factory('plotarea'),
         $Plotarea2 = Image_Graph::factory('plotarea'),
       50
      ),
      5
   )
);

$Dataset1 =& Image_Graph::factory('dataset');
$Dataset1->addPoint('Jan', 5, 'J');
$Dataset1->addPoint('Feb', 13, 'F');
$Dataset1->addPoint('March', 10, 'M');

$Dataset2 =& Image_Graph::factory('dataset');
$Dataset2->addPoint('Jan', 6, 'J');
$Dataset2->addPoint('Feb', 13, 'F');
$Dataset2->addPoint('March', 10, 'M');

$Plot1 =& $Plotarea1->addNew('bar', &$Dataset1);
$Plot2 =& $Plotarea2->addNew('bar', &$Dataset2);

$Plot1->setLineColor('green');
$Plot1->setBackgroundColor('[email protected]');

$fill =& Image_Graph::factory('Image_Graph_Fill_Array');
$fill->addColor('[email protected]', 'J');
$fill->addColor('[email protected]', 'F');
$fill->addColor('[email protected]', 'M');
$Plot1->setFillStyle($fill);
$Plot2->setFillStyle($fill);

$Font =& $Graph->addNew('ttf_font', 'Bitstream-Vera-Sans-Mono');
$Font->setSize(12);
$Graph->setFont($Font);

$YAxis1 =& $Plotarea1->getAxis(IMAGE_GRAPH_AXIS_Y);
$YAxis1->setTitle('Rainy Days', 'vertical');
$XAxis1 =& $Plotarea1->getAxis(IMAGE_GRAPH_AXIS_X);
$XAxis1->setTitle('Month');

$YAxis2 =& $Plotarea2->getAxis(IMAGE_GRAPH_AXIS_Y);
$YAxis2->setTitle('Minimum Temperature', 'vertical');
$XAxis2 =& $Plotarea2->getAxis(IMAGE_GRAPH_AXIS_X);
$YAxis2->setInverted(true);
$XAxis2->setInverted(true);

$Graph->done();
?>
Conclusion
Hopefully you’ll enjoy using Image_Graph as much as I have, and, with the help of these last two articles, find the initiation a little easier than I did. It’s an impressive package for one still in alpha status, and with an active community, including a forum, it’s already in better shape than some of the stable PEAR packages, and is sure to develop rather quickly.