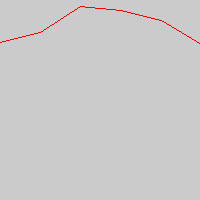
What we need to do is alter our code that determines the y position so that it works in the opposite way – change the line.
<?php
ImageLine
($image,$points[$i][0],$points[$i][1],$points[$i+1][0],$points[$i+1][1],$red);
?>
To read:
<?php
ImageLine
($image,$points[$i][0],200-$points[$i][1],$points[$i+1][0],200-$points[$i+1][1],$red);
?>
And we are presented with the graph:

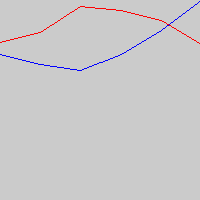
All we need to do now is add a line that graphs the data from Atlanta and we’ll be done.
<?php
  $sql = "SELECT g_num FROM sales WHERE g_team='Atlanta' ORDER BY g_month";


  $salesResult = mysql_query($sql,$connect);


  $columns = mysql_num_rows($salesResult);


  $xincrement = bcdiv(200,$columns-1,0);


  $x=0;


  $i=0;


  while($salesRow=mysql_fetch_array($salesResult)) {


      $y = bcmul(bcdiv($salesRow[0],$max,2),200,2);


    $points[$i][0] = $x;


    $points[$i][1] = $y;


    $x+=$xincrement;


    $i++;


  }


  for($i=0;$i<$columns-1;$i++) {


    ImageLine($image,$points[$i][0],200-$points[$i][1],$points[$i+1][0],200-$points[$i+1][1],$blue);


  }
?>

The data we’ve used in this example has been static – in the next section we’ll take
a look at how we can handle dynamic data and have a look at adding some axes and labels to the graph.
a look at how we can handle dynamic data and have a look at adding some axes and labels to the graph.
–Allan


