Magento is the world’s most popular open source e-commerce platform, relied upon by countless Fortune 500 and small business alike for selling goods and services of all types. Heralded not only for its hundreds of useful features such as support for multiple payment and shipping providers, the ability to sell virtual products, and a powerful shopping cart, but also because the platform is infinitely extensible, capable of being modified to suit even the most exotic project requirements.
But with Magento’s considerable power comes a great deal of complexity, and many newcomers grow quickly frustrated by the dizzying number of core classes, XML-based layout schemas, and database tables. Whether extending Magento to tweak a feature or extend the platform in an entirely new way, it can be incredibly difficult to even identify the origin of an error let alone resolve it. You can however dramatically improve your productivity as a Magento developer by taking advantage of a few key debugging features.
Enable Magento Developer Mode
One of the very first sources of frustration encountered by new Magento developers is the dreaded Exception printing is disabled error message (see Figure 1). This cryptic message appears any time an exception occurs, with Magento choosing to display this message rather than potentially unwittingly output sensitive system details to the browser window. While this concern for security is certainly appreciated, the lack of readily available debugging information during the development phase isn’t exactly convenient. Fortunately, configuring Magento to output details regarding the exception is easy. Navigate to the errors directory located in your project root directory and rename the file local.xml.sample to local.xml.

Figure 1. The Dreaded Magento Disabled Exception Message
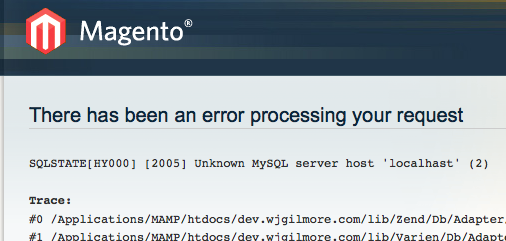
After renaming the file, reload the page and you should be presented with a much more useful error message. Figure 2 presents an example of just such an error message, which clearly indicates that I mistyped localhost when entering the MySQL database connection credentials into etc/local.xml.

Figure 2. Magento: Reviewing Relevant Exception Information
Enable Magento Logging
When troubleshooting your extensions it’s useful to peer into the contents of various objects. However, many Magento objects tend to be exceedingly large, and attempts to output their contents to the browser will often cause your browser to become unstable, not to mention prevent the page from rendering properly. You can instead output object contents (and any other logging data for that matter) to Magento’s system log by enabling logging. Once enabled, you’ll be able to use the Mage::log() method to dump object contents and other log messages to the var/log/system.log file, as demonstrated here:
Mage::Log($customer);
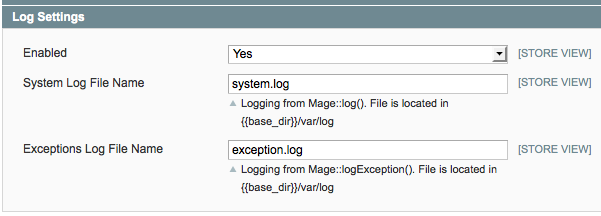
To enable logging, login to the Magento administration console, navigate to System > Configuration, and click on the Developer tab located on the lower left-hand side of the menu. Next click on the Log Settings section, and enable logging by setting the Enabled select box to Yes (see Figure 3).

Figure 3. Enabling Magento Logging
When repeatedly testing a particular feature, I typically open a console window and run the tail command with the -f option, which causes tail to continuously monitor and output any newly appended messages.
Magento Template Path Hints
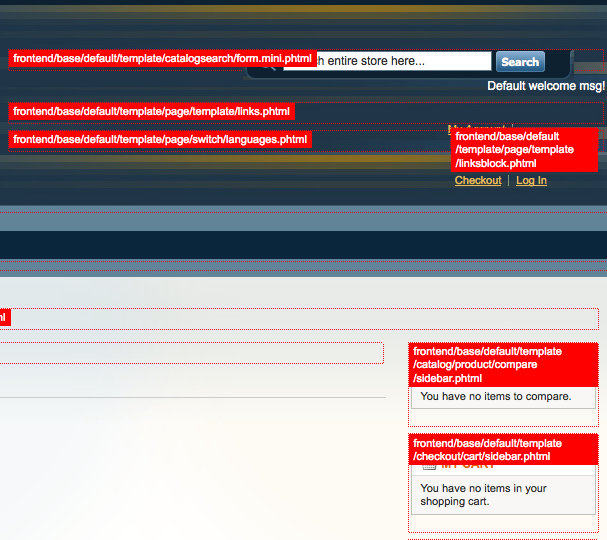
Most Magento pages are actually assembled from several and in some cases more than a dozen different sub-templates. While the default Magento theme can be an incredibly useful example for learning exactly how to go about assembling your own theme, it’s hard to determine which sub-templates are incorporated into a page. Fortunately, Magento offers a great feature known as Template Path Hints which overlays the path and name of each sub-template atop the page, as depicted in Figure 4.

Figure 4. Using Magento Template Hints
Review the Raw SQL Queries
Magento collections are incredibly powerful, but can be pretty difficult to debug particularly when working with multiple table joins. For instance, the following example demonstrates using Magento’s API to retrieve a list of customer shipping addresses:
$query = Mage::getModel('customer/customer') ->getCollection() ->addNameToSelect() ->joinAttribute('shipping_company',
'customer_address/company', 'default_shipping', null, 'left') ->joinAttribute('shipping_street',
'customer_address/street', 'default_shipping', null, 'left') ->joinAttribute('shipping_city',
'customer_address/city', 'default_shipping', null, 'left') ->joinAttribute('shipping_postcode',
'customer_address/postcode', 'default_shipping', null, 'left') ->joinAttribute('shipping_region',
'customer_address/region', 'default_shipping', null, 'left') ->joinAttribute('shipping_country_code',
'customer_address/country_id', 'default_shipping', null, 'left') ->addFieldToFilter('shipping_country_code', array('eq' => 'US'))
So what does the actual SQL query look like? You can send the raw SQL to your log using the printLogQuery(true) method:
echo $query->printLogQuery(true);
Other Useful Debugging Tools
In addition to taking advantage of the aforementioned debugging tools, there are several utilities which I highly recommend installing. Three of my personal favorites include:
-
* Firebug: Firebug is one of the most indispensable tools available to web developers. I regularly use Firebug for quickly inspecting a particular Magento theme HTML element and associated CSS, in addition to monitoring Ajax-related traffic as it passes between the client and server.
-
* phpMyAdmin: phpMyAdmin is a web-based MySQL administration utility useful for not only creating and managing databases, but also for searching databases for a particular bit of text. I use phpMyAdmin’s convenient search utility on a regular basis when the need arises to determine which of Magento’s hundreds of tables contains a particular value.
-
* Eclipse: Although debugging is only a small part of what Eclipse can do, I find it’s code completion capabilities in particular to be a huge help when determining what methods are available to the often overwhelming number of Magento models and other objects.
Conclusion
Magento’s learning curve is undoubtedly steep, however by taking advantage of a few key debugging features you’ll soon be on your way towards creating the next killer extension! Have you uncovered any other useful Magento debugging tools? If so, tell us about them in the comments!
About the Author
W.J. Gilmore is founder of the publishing, training, and consulting firm WJGilmore.com. He is the author of several popular books, including “Easy PHP Websites with the Zend Framework”, “Easy PayPal with PHP”, and “Beginning PHP and MySQL, Fourth Edition”. Follow him on Twitter at @wjgilmore.


