Fill Arrays
You’re also likely to want to use different colours for different bars. To do this, we need to give each dataset a unique identifier, as well as use a fill array to match the colours with the element. Here’s an example:
image_graph3.php

<?php
include 'Image/Graph.php';
$Graph =& Image_Graph::factory('graph', array(600, 300));
$Plotarea =& $Graph->addNew('plotarea');
$Dataset =& Image_Graph::factory('dataset');
$Dataset->addPoint('Jan', 5, 'J');
$Dataset->addPoint('Feb', 13, 'F');
$Dataset->addPoint('March', 10, 'M');
$Plot =& $Plotarea->addNew('bar', &$Dataset);

$Plot->setLineColor('green');
$Plot->setBackgroundColor('[email protected]');

$fill =& Image_Graph::factory('Image_Graph_Fill_Array');
$fill->addColor('red', 'J');
$fill->addColor('blue', 'F');
$fill->addColor('yellow', 'M');
$Plot->setFillStyle($fill);

$Graph->done();
?>
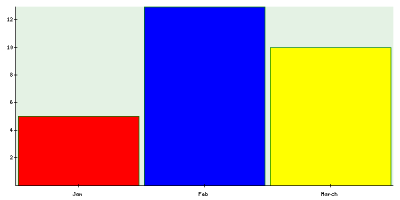
What’s new here is that we’re using the Image_Graph_Fill_Array class. Then a color is assigned to each element, based on the name it was given when it was defined. It’s also possible to leave out the name, in which case it will be assigned from first to last element, but it’s a much better practice to specifically assign these rather than rely on the order they were added.
Fonts and Titles
image_graph4.php

<?php
include 'Image/Graph.php';
$Graph =& Image_Graph::factory('graph', array(600, 300));
$Plotarea =& $Graph->addNew('plotarea');
$Dataset =& Image_Graph::factory('dataset');
$Dataset->addPoint('Jan', 5, 'J');
$Dataset->addPoint('Feb', 13, 'F');
$Dataset->addPoint('March', 10, 'M');
$Plot =& $Plotarea->addNew('bar', &$Dataset);

$Plot->setLineColor('green');
$Plot->setBackgroundColor('[email protected]');

$fill =& Image_Graph::factory('Image_Graph_Fill_Array');
$fill->addColor('red', 'J');
$fill->addColor('blue', 'F');
$fill->addColor('yellow', 'M');
$Plot->setFillStyle($fill);

$Font =& $Graph->addNew('ttf_font', 'Bitstream-Vera-Sans-Mono');
$Font->setSize(12);
$Graph->setFont($Font);

$YAxis =& $Plotarea->getAxis(IMAGE_GRAPH_AXIS_Y);
$YAxis->setTitle('Rainy Days', 'vertical');
$XAxis =& $Plotarea->getAxis(IMAGE_GRAPH_AXIS_X);
$XAxis->setTitle('Month');

$Graph->done();
?>
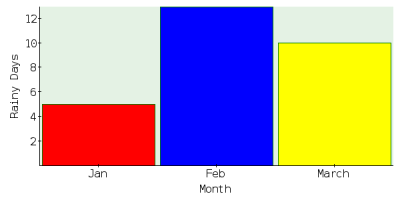
First, the font used for the text elements is set to the ttf font Bitstream-Vera-Sans-Mono, size 12. A common error at this point would be something like:
Warning: imagettfbbox(): Could not find/open font in /usr/share/php/Image/Canvas/GD.php on line 1245
This occurs if you don’t have the correct (or any) fonts in your Fonts directory, found at php/Image/Canvas/Fonts/. Make sure that you have the corresponding .ttf file located in your Fonts directory. For the above example we require Bitstream-Vera-Sans-Mono.ttf. Next, the x and y axes are given titles. Note that the y-axis title runs vertically.
Multiple Plotareas
As mentioned earlier, a single graph can have multiple plotareas. In this next example, there are three plotareas on the graph:
image_graph5.php

<?php
include 'Image/Graph.php';
$Graph =& Image_Graph::factory('graph', array(600, 300));

$Graph->add(
    Image_Graph::horizontal(
        Image_Graph::vertical(
            $PlotareaTopLeft = Image_Graph::factory('plotarea'),
            $PlotareaBottomLeft = Image_Graph::factory('plotarea'),
            60
        ),
            $PlotareaRight = Image_Graph::factory('plotarea'),
        30
    )
);

$Dataset =& Image_Graph::factory('dataset');
$Dataset->addPoint('Jan', 5, 'J');
$Dataset->addPoint('Feb', 13, 'F');
$Dataset->addPoint('March', 10, 'M');
$Plot =& $PlotareaRight->addNew('bar', &$Dataset);

$Plot->setLineColor('green');
$Plot->setBackgroundColor('[email protected]');

$fill =& Image_Graph::factory('Image_Graph_Fill_Array');
$fill->addColor('red', 'J');
$fill->addColor('blue', 'F');
$fill->addColor('yellow', 'M');
$Plot->setFillStyle($fill);

$Font =& $Graph->addNew('ttf_font', 'Bitstream-Vera-Sans-Mono');
$Font->setSize(12);
$Graph->setFont($Font);

$YAxis =& $PlotareaRight->getAxis(IMAGE_GRAPH_AXIS_Y);
$YAxis->setTitle('Rainy Days', 'vertical');
$XAxis =& $PlotareaRight->getAxis(IMAGE_GRAPH_AXIS_X);
$XAxis->setTitle('Month');

//2nd Plotarea
$Plot2 =& $PlotareaTopLeft->addNew('pie', &$Dataset);
$Plot2->setLineColor('green');
$Plot2->setBackgroundColor('[email protected]');

$fill =& Image_Graph::factory('Image_Graph_Fill_Array');
$fill->addColor('red', 'J');
$fill->addColor('blue', 'F');
$fill->addColor('yellow', 'M');
$Plot2->setFillStyle($fill);

//3rd Plotarea
$Plot3 =& $PlotareaBottomLeft->addNew('line', &$Dataset);
$Plot3->setLineColor('green');
$Plot3->setBackgroundColor('[email protected]');

$Graph->done();
?>
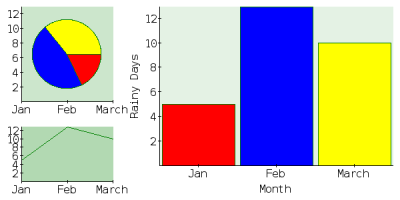
First, the graph is divided horizontally into two areas: the leftmost plotarea which is taking up 30% of the space, and the right one which is taking up the remainder. The left area is then further broken into two plotareas, the top one taking up 60% of the space. Using the same dataset, we create two new types: a pie graph and a line graph. There are a number of possible types. We’ll look at them in more detail in a future article, but the list consists of:
- line (Image_Graph_Plot_Line)
- area (Image_Graph_Plot_Area)
- bar (Image_Graph_Plot_Bar)
- smooth_line (Image_Graph_Plot_Smoothed_Line)
- smooth_area (Image_Graph_Plot_Smoothed_Area)
- pie (Image_Graph_Plot_Pie)
- step (Image_Graph_Plot_Step)
- impulse (Image_Graph_Plot_Impulse)
- dot (Image_Graph_Plot_Dot)
- scatter, a synonym for dot
- radar (Image_Graph_Plot_Radar)
- Image_Graph_Plot_CandleStick
- Image_Graph_Plot_Band
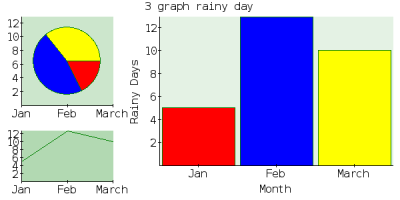
A Heading
Finally, we’ll add a title to the graph. A title is placed in an area that’s assigned in the same way as the earlier three plotareas. We’ll add another vertical division at the top, 5% high, for our heading.
<?php
include 'Image/Graph.php';
$Graph =& Image_Graph::factory('graph', array(600, 300));

$Graph->add(
  Image_Graph::vertical(
    Image_Graph::factory('title',array('3 graph rainy day',12)),
    Image_Graph::horizontal(
        Image_Graph::vertical(
            $PlotareaTopLeft = Image_Graph::factory('plotarea'),
            $PlotareaBottomLeft = Image_Graph::factory('plotarea'),
            60
        ),
            $PlotareaRight = Image_Graph::factory('plotarea'),
        30
    ),
    5
  )
);

$Dataset =& Image_Graph::factory('dataset');
$Dataset->addPoint('Jan', 5, 'J');
$Dataset->addPoint('Feb', 13, 'F');
$Dataset->addPoint('March', 10, 'M');
$Plot =& $PlotareaRight->addNew('bar', &$Dataset);

$Plot->setLineColor('green');
$Plot->setBackgroundColor('[email protected]');

$fill =& Image_Graph::factory('Image_Graph_Fill_Array');
$fill->addColor('red', 'J');
$fill->addColor('blue', 'F');
$fill->addColor('yellow', 'M');
$Plot->setFillStyle($fill);

$Font =& $Graph->addNew('ttf_font', 'Bitstream-Vera-Sans-Mono');
$Font->setSize(12);
$Graph->setFont($Font);

$YAxis =& $PlotareaRight->getAxis(IMAGE_GRAPH_AXIS_Y);
$YAxis->setTitle('Rainy Days', 'vertical');
$XAxis =& $PlotareaRight->getAxis(IMAGE_GRAPH_AXIS_X);
$XAxis->setTitle('Month');

//2nd Plotarea
$Plot2 =& $PlotareaTopLeft->addNew('pie', &$Dataset);
$Plot2->setLineColor('green');
$Plot2->setBackgroundColor('[email protected]');

$fill =& Image_Graph::factory('Image_Graph_Fill_Array');
$fill->addColor('red', 'J');
$fill->addColor('blue', 'F');
$fill->addColor('yellow', 'M');
$Plot2->setFillStyle($fill);

//3rd Plotarea
$Plot3 =& $PlotareaBottomLeft->addNew('line', &$Dataset);
$Plot3->setLineColor('green');
$Plot3->setBackgroundColor('[email protected]');

$Graph->done();
?>
Conclusion
There’s a lot more to Image_Graph than we’ve managed to cover here. We’ll take a further look in a future article, but hopefully this will give you a taste for further exploration of this powerful package on your own. Good luck!