Diving feet first into a software development project without devoting the time to configure your tooling, organize a team, or even merely think about how the software should actually work can lead to almost maddening despair. For many developers, it seems the mere act of writing code — no matter how poor that code may be — is enough to declare the workday a success. Over time, this manic desire “to get started” becomes a habit, and one which is very hard to break.
Although the negative effects are many, one particularly grave result of prematurely writing code is countless hours lost to debugging with substandard approaches. For many PHP developers, this approach has long involved embedding
echo or print_r statements into the code with the goal of viewing the value of application variables as the page executes. While this approach certainly has its occasional merits, there is a far more effective technique, one that I guarantee will help set you on the road of success. This approach involves using an open source debugging tool named XDebug, and in this article I’ll help you get started using this powerful solution.XDebug is a PHP extension created by longtime PHP core contributor Derick Rethans. Because it is a PHP extension, XDebug can (and does) directly affect certain PHP behaviors in ways that greatly improves the developer’s ability to identify and resolve code errors. After installing XDebug, we’ll work through a few examples that clearly denote these improvements.
Installing XDebug
XDebug can be installed in a variety of ways, however the easiest is by using the PECL installer.
%>pecl install xdebug
Once installed, you’ll need to add one of two lines to your
php.ini file, replacing /PATH/TO with the actual path leading to the newly installed xdebug.so file. If you’re using PHP in non-threaded mode (running it in CGI mode, for instance), insert the following line. Also be sure to use this variation if you’re running PHP 5.3.
zend_extension = /PATH/TO/xdebug.so
If you’re running PHP as an ISAPI module or using Apache 2’s MPM mode, use the following line:
zend_extension_ts = /PATH/TO/xdebug.so
Save the
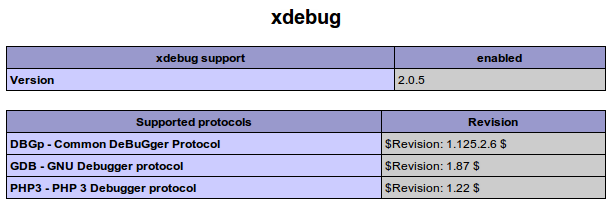
php.ini changes, restart your Web server, and load your PHP Info page (using the phpinfo()) function, and you should see a new section titled “xdebug,” which contains quite a bit of information about the extension’s configuration. I’ve included the top-most part of what that section will look like in Figure 1. 
Click here for larger image
Figure 1. Check Your PHP Info Page to Make Sure XDebug Is Properly Installed
If you are for some reason unable to use the PECL installer, see the XDebug documentation for alternative installation approaches.
Examining Object Contents with XDebug
Once installed, XDebug will immediately have a profound impact on your ability to resolve errors in your code. Don’t believe me? Suppose you wanted to examine the contents of an object after having set a few attributes. This is typically done using the
var_dump() function. For instance, consider the following example:
<?php
class Book
{
  private $_title;
  private $_authors;
  private $_pages;
  public function setAuthors($authors)
  {
    $this->_authors = $authors;
  }
}
$book = new Book();
$authors = array("Jason", "Eddie", "Jon");
$book->setAuthors($authors);
var_dump($book);
?>
With XDebug disabled or uninstalled, the above example’s output looks like this:
object(Book)#1 (3) { ["_title":"Book":private]=> NULL ["_authors":"Book":private]=>
array(3) { [0]=> string(5) "Jason" [1]=> string(5) "Eddie" [2]=> string(3) "Jon" }
["_pages":"Book":private]=> NULL
Even given the relative simplicity of the object, this output is already quickly becoming difficult to read. However, executing the very same script with XDebug greatly improves the readability of this output:
object(Book)[1]
  private '_title' => null
  private '_authors' =>
    array
      0 => string 'Jason' (length=5)
      1 => string 'Eddie' (length=5)
      2 => string 'Jon' (length=3)
  private '_pages' => null


