Viewing SuperGlobals
When debugging a script’s form-handling functionality, you often should examine the form’s input values in order to properly diagnose how exactly the script is responding. Using the
xdebug_dump_superglobals() function, you can easily peer into the POSTed values. For instance, consider the form presented in Figure 2.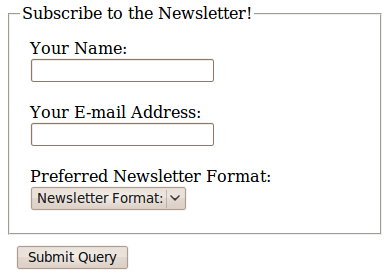
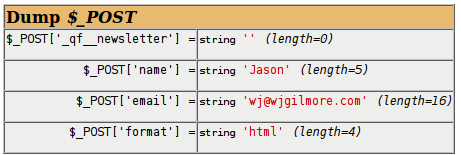
The
xdebug_dump_superglobals() function is actually capable of examining all values falling into PHP’s superglobal arrays. However, because we’re interested only in the POST array, we’ll configure the function to only return those values by filtering the superglobal setting through the xdebug.dump.* configuration directive:
if ($_POST) {
  ini_set('xdebug.dump.POST', '*');
  xdebug_dump_superglobals();
}
Executing this snippet after submitting the form produces the output shown in Figure 3.
You can configure the
xdebug.dump.* directive to display all superglobals, display just one superglobal array as was demonstrated above, or even selectively display only certain keys within a specific array. For instance, if you’re interested only in examining the $_SERVER array’s REMOTE_ADDR and QUERY_STRING values, set the xdebug.dump.post.* like this:
ini_set('xdebug.dump.SERVER', 'REMOTE_ADDR, QUERY_STRING');
Other XDebug Features
The examples provided here only scratch the surface regarding what’s possible with XDebug, so I thought it would be worth concluding this tutorial with a brief summary of what else is possible:
- Function tracing: When transforming variable values using a series of functions, you’ll often need to figure out where along the process the transformation went wrong. Using XDebug’s function-tracing capabilities, you can view both the input and output values of each function.
- Performance profiling: Using XDebug’s native code profiler, you can review the performance of each script and determine where bottlenecks are occurring.
- Remote debugging: Using XDebug’s remote debugging capabilities, you can step through running PHP code and examine its state along the way.
Be sure to consult the XDebug documentation to learn what else is possible!
Conclusion
XDebug takes only a moment to install, and as the examples presented here demonstrate, will save you countless hours of debugging frustration.
About the Author
Jason Gilmore is the founder of EasyPHPWebsites.com and the author of
several popular books, including “Easy
PHP Web sites with the Zend Framework” and “Beginning
PHP and MySQL: From Novice to Professional” (currently in its third edition).
Check out his new DZone reference card, titled “Getting
Started with the Zend Framework.”
several popular books, including “Easy
PHP Web sites with the Zend Framework” and “Beginning
PHP and MySQL: From Novice to Professional” (currently in its third edition).
Check out his new DZone reference card, titled “Getting
Started with the Zend Framework.”