3. Debugging Ajax with FireBug and FirePHP
Debugging Ajax-enabled websites is particularly tedious, because it can be really difficult to determine which of the several scripts in a typical request is responsible for the problem. For instance, the problem may lie with the JavaScript responsible for issuing a request, the server-side PHP script responsible for processing the request, the JavaScript responsible for receiving and completing the request, or any combination of the three.
Two invaluable tools that greatly reduce the amount of guesswork involved in debugging Ajax-driven applications are FireBug and FirePHP. FireBug is an invaluable Firefox-specific add-on, which you can use to inspect and tweak HTML and CSS elements, debug and profile JavaScript, and carry out a great deal of other developer-specific tasks. For instance, with FireBug enabled, you can review the JSON returned from a PHP script using the FireBug console, as demonstrated in Figure 1.
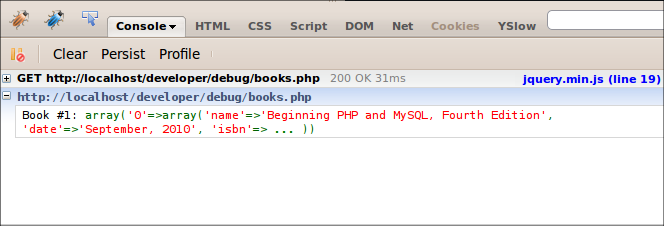
FirePHP further enhances FireBug’s capabilities by providing you with a vehicle for sending debug information from your PHP script directly to FireBug’s console. For instance, Figure 2 depicts a log message containing a PHP array’s contents, which was sent to the FireBug console via a PHP script.
After installing and configuring FirePHP, you can begin logging messages to the FireBug console simply by including the FirePHP library within your script (available with the FirePHP PEAR installer), instantiate the FirePHP class, and class’
log() method to send log output to the client browser. Here’s an example that produces the output found in Figure 2:<php require_once('FirePHP.class.php'); $firephp = FirePHP::getInstance(true); $books = array(); $books[] = array ( "name" => "Beginning PHP and MySQL, Fourth Edition", "date" => "September, 2010", "isbn" => "1430231149" ); $firephp->log($books, 'Book #1'); ?> Read the Developer.com tutorial Add Browser-Based Debugging to Your Ajax Development for an introductory tutorial to these powerful technologies.
4. Proactively Resolving Errors Through Test-Driven Development
Of course, the most effective way to debug your applications is to not have any errors to deal with in the first place! Unfortunately this is easier said than done. A movement known as test-driven development seeks to make the task of ferreting out errors a natural part of the development process by requiring the developer to first write tests that when passing will confirm a proper implementation of a particular software feature. With no accompanying implementation code, these tests naturally fail until the developer produces code capable of causing the tests to pass.
Although this may sound contradictory to those of you unfamiliar with the concept, test-driven development’s “backwards” approach causes developers to think about the scenarios that could cause code to fail first, rather than doing so after an implementation is complete.
PHP developers have several great testing frameworks at their disposal, including PHPUnit. PHPUnit supports an impressive array of testing scenarios, integrates well into continuous integration and deployment utilities such as phpUnderControl and Phing, and can even integrate with Selenium to facilitate user interface tests.
Check out the article Use PHPUnit to Implement Unit Testing in Your PHP Development to learn more about how PHPUnit can help proactively reduce the errors in your PHP code.
Conclusion
While we’d all like to believe perfect code will flow from our fingertips with each programming session, our track records indicate a different outcome is almost certain. Thanks to powerful tools such as XDebug, FireBug, FirePHP, and PHPUnit, you’ll be able to overcome less-than-perfect code in no time!
About the Author
Jason Gilmore is the founder of the publishing and consulting firm WJGilmore.com. He also is the author of several popular books, including “Easy PHP Websites with the Zend Framework”, “Easy PayPal with PHP”, and “Beginning PHP and MySQL, Fourth Edition”. Follow him on Twitter at @wjgilmore.


