At some point, most developers have a need to create graphs. I’ve known some to get frustrated and end up exporting the data to a spreadsheet, rather than relying upon the graphing capabilities of Open Office or Excel. That can be the way to go in certain cases, but not because there’s no alternative. PHP has some great graphing libraries; JpGraph is probably the most well-known, but it can require a commercial licence. This article looks at PEAR’s Image_Graph package, which is released under the Lesser GPL. It’s a package that has very little documentation, but which deserves more recognition. It’s helpful to have used PEAR before, but if this is the first PEAR package you’ll use, you’ll probably cope just fine.
Formerly a SourceForge package known as GraPHPite, it merged with and took the name of an older PEAR Image_Graph package. The graphs, charts and plots produced by Image_Graph are highly customizable, and can be any of area, band, bar, box and whisker, candlestick, impulse, map, line, pie, radar, scatter, smoothed line and step.
Requirements
To install Image_Graph, you need:
- PHP 4.3.0 or later (it works with PHP 5)
- GD (GD 2 is recommended)
- PEAR support
- The Image_Canvas package
- The Image_Color package
Installing
Installing packages on PEAR is easy using the pear command. You can see what PEAR packages are already on your system by running pear list. A default installation may look like this:
$ pear list
Installed packages:
===================
Package        Version State
Archive_Tar    1.1     stable
Console_Getopt 1.2     stable
DB             1.6.2   stable
HTTP           1.2.2   stable
Mail           1.1.3   stable
Net_SMTP       1.2.6   stable
Net_Socket     1.0.1   stable
PEAR           1.3.2   stable
XML_Parser     1.0.1   stable
XML_RPC        1.1.0   stable
There are two main ways to install a PEAR package. You can install directly from the PEAR server, or you can download and install from your local machine. The mechanism is effectively the same. Some packages are still in alpha, including Image_Graph, so it won’t appear on the main list of stable packages that are available (which you can view by running pear remote-list.
In this article we’ll install by downloading. Assuming you have a default install, you’ll need to download the following three packages: Image_Color, Image_Canvas and Image_Graph. Note that there may be newer versions out by the time you do this. It’s unlikely, but you should also check to see if there’re any new dependencies (they’ll be listed on the download page). To install them, simply run the pear install command. Make sure you get the order right to avoid any dependency failures.
$ pear install Image_Color-1.0.2.tgz
install ok: Image_Color 1.0.2

$ pear install Image_Canvas-0.3.0.tgz
install ok: Image_Canvas 0.3.0

$ pear install Image_Graph-0.7.2.tgz
Optional dependencies:
package `Numbers_Roman' is recommended to utilize some features.
package `Numbers_Words' is recommended to utilize some features.
install ok: Image_Graph 0.7.2
The Numbers_Roman and Numbers_Words packages are optional extras, but we’re not going to use them for our purposes here.
A Simple Bar Chart Example
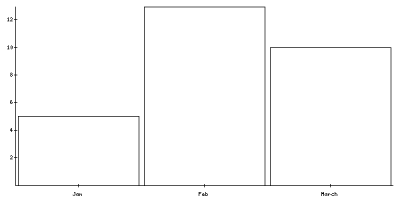
Creating a bar chart is probably easiest of all. Let’s start with some sample code to do just that. The examples are going to hardcode the data, but I’m sure you’re more than capable of reading the data from a database or some other source, and that’ll just complicate the graphing examples.
image_graph.php

<?php
include 'Image/Graph.php';
$Graph =& Image_Graph::factory('graph', array(600, 300));
$Plotarea =& $Graph->addNew('plotarea');
$Dataset =& Image_Graph::factory('dataset');
$Dataset->addPoint('Jan', 5);
$Dataset->addPoint('Feb', 13);
$Dataset->addPoint('March', 10);
$Plot =& $Plotarea->addNew('bar', &$Dataset);

$Plot->setLineColor('green');
$Plot->setFillColor('cadetblue');
$Plot->setBackgroundColor('[email protected]');

$Graph->done();
?>

The first line:
include 'Image/Graph.php';
is all that’s required to use the Image_Graph package. Include it first in any code that will need graphing. The next line,
$Graph =& Image_Graph::factory('graph', array(600, 300));
instantiates the graph object, and creates a canvas 600 pixels wide by 300 pixels high. It makes use of the Factory design pattern. You don’t have to use this pattern, but it makes your life a bit easier. A discussion of the factory design pattern is beyond the scope of this article, but all it really means for our purposes is that you usually only need to have the one include statement (above). The next line:
$Dataset =& Image_Graph::factory('dataset');
creates a dataset, which will contain the data to use in creating the graph. There are two main types of datasets: the ordinary one, used here, which is basically an array of data points, and a more complex function-based one, which we’ll look at later. Next, the data points are added:
$Dataset->addPoint('Jan', 5);
$Dataset->addPoint('Feb', 13);
$Dataset->addPoint('March', 10);
Having defined the plotarea, as well as the data points, all that’s needed is to define the plot that will appear on the plotarea.
$Plot =& $Plotarea->addNew('bar', &$Dataset);
There can be multiple plots, but in this case there’s just one. There are also multiple plot types (as mentioned earlier), but we’re just adding a simple bar graph for now. Finally, the done method renders the graph:
$Graph->done();
Try experimenting with different values, and different numbers of values. You’ll notice that the largest value always fills up 100% of the space, and the others fill an area in proportion to this. If 10 is your highest value, a point with a value of 5 fills up 50%, while if 20 is your highest value, the 5 fills up 25%. All this should be expected with bar graphs.
Some Color
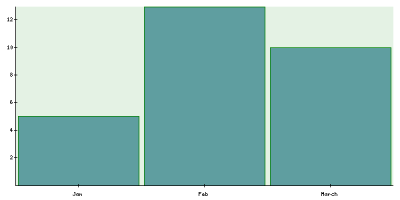
With the default settings, your graph is hardly going to win any awards. Let’s make it a little more readable with some colors.
image_graph2.php

<?php
include 'Image/Graph.php';
$Graph =& Image_Graph::factory('graph', array(600, 300));
$Plotarea =& $Graph->addNew('plotarea');
$Dataset =& Image_Graph::factory('dataset');
$Dataset->addPoint('Jan', 5);
$Dataset->addPoint('Feb', 13);
$Dataset->addPoint('March', 10);
$Plot =& $Plotarea->addNew('bar', &$Dataset);

$Plot->setLineColor('green');
$Plot->setFillColor('cadetblue');
$Plot->setBackgroundColor('[email protected]');<php
include 'Image/Graph.php';
$Graph =& Image_Graph::factory('graph', array(600, 300));
$Plotarea =& $Graph->addNew('plotarea');
$Dataset =& Image_Graph::factory('dataset');
$Dataset->addPoint('Jan', 5, 'J');
$Dataset->addPoint('Feb', 13, 'F');
$Dataset->addPoint('March', 10, 'M');
$Plot =& $Plotarea->addNew('bar', &$Dataset);

$Plot->setLineColor('green');
$Plot->setBackgroundColor('[email protected]');

$fill =& Image_Graph::factory('Image_Graph_Fill_Array');
$fill->addColor('red', 'J');
$fill->addColor('blue', 'F');
$fill->addColor('yellow', 'M');
$Plot->setFillStyle($fill);

$Graph->done();
?>


$Graph->done();
?>

You can use any of the 147 SVG color names, as well as hex values to define your colours if you wish. The methods are clearly named, so what they do should be fairly self-explanatory.


